 Our World
  Our World
  Crime
Crime 10 Dark Details of the “Bodies in the Barrels” Murders
 Animals
 The Animal Kingdom’s 10 Greatest Dance Moves
 Movies and TV
 10 Box Office Bombs That We Should Have Predicted in 2025
 History
 10 Extreme Laws That Tried to Engineer Society
 History
 10 “Modern” Problems with Surprising Historical Analogs
 Health
 10 Everyday Activities That Secretly Alter Consciousness
 History
 Top 10 Historical Disasters Caused by Someone Calling in Sick
 Animals
 10 New Shark Secrets That Recently Dropped
 Movies and TV
 10 Forgotten Realities of Early Live Television Broadcasts
 Our World
 10 Places with Geological Features That Shouldn’t Exist
 Crime
Crime 10 Dark Details of the “Bodies in the Barrels” Murders
 Animals
 The Animal Kingdom’s 10 Greatest Dance Moves
Who's Behind Listverse?

Jamie Frater
Head Editor
Jamie founded Listverse due to an insatiable desire to share fascinating, obscure, and bizarre facts. He has been a guest speaker on numerous national radio and television stations and is a five time published author.
More About Us Movies and TV
 10 Box Office Bombs That We Should Have Predicted in 2025
 History
 10 Extreme Laws That Tried to Engineer Society
 History
 10 “Modern” Problems with Surprising Historical Analogs
 Health
 10 Everyday Activities That Secretly Alter Consciousness
 History
 Top 10 Historical Disasters Caused by Someone Calling in Sick
 Animals
 10 New Shark Secrets That Recently Dropped
 Movies and TV
 10 Forgotten Realities of Early Live Television Broadcasts
10 Unusual Scientific Scales
It seems today if you want to make your name famous you have two choices – star in “leaked” home pornography tapes, or discover something that has so far eluded the capacity to be measured, find a way to measure it, develop a way to rank the measurements or place them into categories, and attach your name to the resulting scale. For example, the “Frater Scale” could be a ranking of items on a list – a better name for a “top 10 list” – where item 1 ranks as first on the Frater Scale. Not all scales are named after their inventors, but many are. It seems almost anything can be measured and if it can be measured, someone is going to come up with a scale to quantify the measurement. Here are ten unusual scientific scales.

The Kardashev scale is a method of measuring an advanced civilization’s level of technological advancement. The scale is only theoretical and in terms of an actual civilization highly speculative; however, it puts energy consumption of an entire civilization in a cosmic perspective.
It was first proposed in 1964 by the Soviet Russian astronomer, Nikolai Kardashev. The scale has three designated categories called Type I, II and III. These are based on the amount of usable energy a civilization has at its disposal, and the degree of space colonization. In general terms, a Type I civilization has achieved mastery of the resources of its home planet, Type II of its solar system, and Type III of its galaxy. Science fiction also may expand the scale to Type IV, where a civilization has mastery of the resources of its universe, and sometimes Type V, all the universes.
The original and the final draft for this particular scale had energy consumptions ranging so widely from each other, that Kardashev himself revised the scale as to include values between, in hundredths. The human civilization, as of 2010, is currently somewhere around 0.72, with calculations showing we will reach Type I status around 2100, Type II status around 3100 and Type III status from 100,000 thousand to one million years time.

The Pyruvate scale measures pungency in onions and garlic with units of um/gfw. It is named after Pyruvic acid, the alpha-keto acid in onions which makes peoples eyes tear up when cutting them. The standard onion has an eight rating, while “sweet onions” have a two or three rating on the scale. The lower the score or scale, the more “sweet” the onions are rated. Anything less than five is considered a sweet onion.
The Vidalia onion variety are considered sweet, and must have a score of 5.0 um/gfw or less. The Supasweet onion (usually grown in Lincolnshire, England) registers 1.5 to 2 on the scale. A standard brown onion is usually in the range of 6-7 out of 10. Soil type, rain and sunlight affect the pungency in onions and garlic and, therefore, their score on the pyruvate scale.
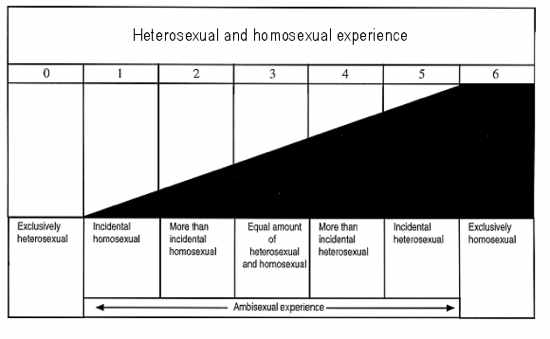
The Kinsey scale attempts to describe a person’s sexual history, or episodes of their sexual activity at a given time. It uses a scale from 0, meaning exclusively heterosexual, to 6, meaning exclusively homosexual – with 3 being equally heterosexual and homosexual (or bisexual). In both the Male and Female volumes of the Kinsey Reports, an additional grade, listed as “X”, was used for asexuality.
Introducing the scale, Kinsey wrote: “males do not represent two discrete populations, heterosexual and homosexual. It is fundamental of taxonomy that nature seldom deals in discrete categories. The living world is a continuum in each and every one of its aspects.” Today, many sexologists see the Kinsey scale as simplistic. They suggest that sexual orientation and sexual identity are more complex and varied

Ever look out over a lake, or the ocean, and admire the color of the water? The deep blue, the aquamarine, the emerald green. But just how emerald is that emerald green water? Well you knew there just had to be a scale for that, and there is. The Forel-Ule Scale is a method to approximately determine the color of bodies of water, used in limnology and oceanography. The method was developed by François-Alphonse Forel and was three years later improved by the German limnologist Willi Ule. By means of different inorganic compounds (ammonia, copper sulfate, neutral potassium chromate) a color palette is produced in a series of numerically designated vials (00-21) which is compared with the color of the water body. The result is a color index for the water body which gives an indication of the transparency of the water and thus helps to classify gross biological activity. The color graduations correspond to open sea and lake water colors, as they appear to an observer ashore or on board a vessel.
Placing the colors onto a handy disk not only gives the observer a means to compare the color of the water to a known value, it also gave another person a chance to immortalize their name. Thus was born the Secchi disk, created in 1865 by Pietro Angelo Secchi. This is a circular disk used to measure water transparency in oceans and lakes. The disc is mounted on a pole or line, and lowered slowly down in the water. The depth at which the pattern on the disk is no longer visible is taken as a measure of the transparency of the water. This measure is known as the Secchi depth and is related to water turbidity.
The Forel-Ule Scale is quite imprecise, and thus rarely used in modern research. It was substituted by the Platinum-Cobalt Scale. The Platinum-Cobalt Scale is a color scale that was introduced in 1892 by chemist Allen Hazen, who, for reasons probably lost to history, did not name the scale the “Hazen Scale”. The index was developed as a way to evaluate pollution levels in waste water. It has since expanded to a common method of comparison of the intensity of yellow-tinted samples. It is specific to the color yellow and is based on dilutions of a 500 ppm platinum cobalt solution.

We know that Earth has been clobbered by asteroids and objects from outer space. A trip to Meteor Crater Arizona will show you the incredible devastation that an object from outer space delivers when it impacts the Earth. Dinosaurs are thought to have become extinct from a great asteroid collision with the Earth.
But how likely is it that the Earth is going to be struck by an asteroid, say, tomorrow? And if so, how much damage can we expect? And how worried should we be that such a cataclysmic event will happen? Fortunately, there is a scale for both concerns. The Palermo Technical Impact Hazard Scale was developed to enable scientists to categorize, and prioritize, potential impact risks spanning a wide range of impact dates, energies and probabilities.
Actual scale values less than -2 reflect events for which there are no likely consequences, while Palermo Scale values between -2 and 0 indicate situations that merit careful monitoring. Potential impacts with positive Palermo Scale values will generally indicate situations that merit some level of concern.
The scale compares the likelihood of the detected potential impact with the average risk posed by objects of the same size, or larger, over the years until the date of the potential impact. This average risk from random impacts is known as the background risk. For convenience the scale is logarithmic, so, for example, a Palermo Scale value of -2 indicates that the detected potential impact event is only 1% as likely as a random background event occurring in the intervening years, a value of zero indicates that the single event is just as threatening as the background hazard, and a value of +2 indicates an event that is 100 times more likely than a background impact by an object at least as large before the date of the potential impact in question. Confused yet?
The Torino Scale is designed to communicate to the public the risk associated with a future Earth approach by an asteroid or comet. This scale, which has integer values from 0 to 10, takes into consideration the predicted impact energy of the event, as well as its likelihood of actually happening (i.e., the event’s impact probability). The Palermo Scale is used by specialists in the field to quantify, in more detail, the level of concern warranted for a future potential impact possibility. Much of the utility of the Palermo Scale lies in its ability to carefully assess the risk posed by less threatening Torino Scale 0 events, which comprise nearly all of the potential impacts detected to date.
Therefore, because the Torino Scale produces almost exclusively, asteroids of a zero rating, the Palermo Scale was invented to try to categorize asteroid impact events which probably will not happen. The moral of the story is – even scientific scales can produce opportunities to create new scales to attach ones name to.
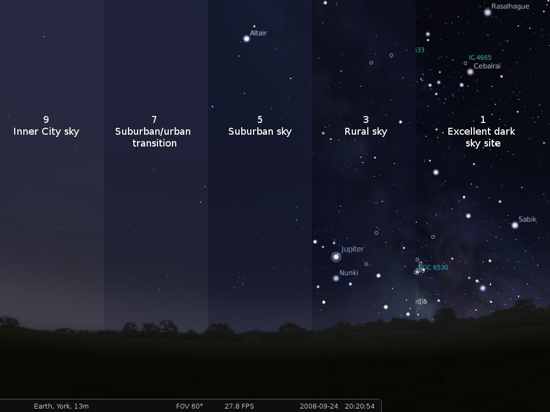
If you are a city dweller and, on occasion, travel out of the urban environment to a more rural area, you might be amazed to see bright lights in the sky not called “the moon”. These are called “stars” and, in most brightly lit urban environments, few stars can be seen in the night sky because of interference from background lighting. It is beautiful to gaze upon the heavens and see the Milky Way and the thousands of stars visible to the human eye under perfect dark sky conditions. How many stars can you see if the night sky is perfectly dark? The Yale Bright Star Catalog catalogs the “naked eye visible stars”, which they consider to be those with a magnitude of 6.5 or brighter at 9,110 stars. Of course you can’t see all 9,110 in any one place on Earth. Some are visible depending if you are in the northern or southern hemisphere and how many of those stars you can see will depend on where you are and how much light pollution there is. That’s where the Bortle Scale comes in.
The Bortle Dark-Sky Scale is a nine-level numeric scale that measures the night sky’s and stars’ brightness (naked-eye and stellar limiting magnitude) of a particular location. It quantifies the astronomical observability of celestial objects and the interference caused by light pollution and skyglow. John E. Bortle created the scale and published it in the February, 2001, edition of Sky & Telescope magazine, to help amateur astronomers compare the darkness of observing sites. The scale ranges from Class 1, the darkest skies available on Earth, through Class 9, inner-city skies. Class 1 dark skies are color coded black. A typical truly dark sky is rated a 2 and color coded grey. A typical rural sky with good visibility is rated 3 and color coded blue. A city rating of 8 or 9 is color coded white.
Here, on the east coast of the United States, one of the best night sky viewing areas is located in northern Pennsylvania, at the Cherry Springs State Park. Located away from, and above, most interfering urban light pollution, the Cherry Springs State park is one of the few places on the east coast where you can typically find excellent dark sky viewing conditions. If you wish to travel to the park, you can use a handy Internet site to judge the predicted weather and viewing conditions before you go. You can go here and see the Bortle Dark Sky Scale in action.

The Ulmer Scale is a list, created by veteran entertainment journalist James Ulmer, which is a 100-point method to quantify a star’s value to a film production, in terms of getting a movie financed and the cameras rolling. The Ulmer Scale also takes into account an actor’s history (box office successes vs. failures), versatility, professional demeanor, and ability and willingness to travel and promote movies. Will Smith led the top ten “A-listers” for the year 2009.
In popular usage outside the movie industry, an “A-list celebrity” simply refers to any person with an admired or desirable social status. In recent times, the term has given rise to any person, regardless of profession, in the limelight. Even socialites with popular press coverage have been termed as “A-list” celebrities. Similarly, less popular persons and current teen idols are referred to as “B-list.” The lowest ranking on the Ulmer Scale is a “C List”. An article on Entertainment Weekly describes a C-list celebrity as “that guy (or sometimes that girl), the easy-to-remember but hard-to-name character actor.”
Though the term “D-list” does not exist on the Ulmer Scale, it is often used to describe persons whose celebrity is so obscure that they are generally only known for appearances as so-called celebrities on reality television.

The progression of male pattern baldness is generally classified on the Hamilton-Norwood scale, which ranges from stages I to VII. This measurement scale was first introduced by Dr. James Hamilton in the 1950s, and later revised and updated by Dr. O’Tar Norwood in the 1970s. The progression of female pattern baldness is generally classified on the Ludwig scale, which ranges from stages I to III. One website rates different celebrities on the Hamilton-Norwood Scale. A few examples include:
Ben Affleck – II
Charlie Sheen – II-III
Bono – III
Prince William – III-IV
Nick Cave – IV
Paul Simon – V-VI
Phil Collins – VI

In ufology, a close encounter is an event in which a person witnesses an unidentified flying object. This terminology and the system of classification behind it was started by astronomer and UFO researcher J. Allen Hynek, and was first suggested in his 1972 book, The UFO Experience: A Scientific Inquiry. The Hynek Scale introduced the first three kinds of encounters which Hynek believed could be supported using scientific rigor. Sightings more than 500 feet (160 m) from the witness are classified as “Daylight Discs,” “Nocturnal Lights,” or “Radar/Visual Reports.” Sightings within about 500 feet are subclassified as various types of “close encounter.” Hynek and others argued a claimed close encounter must occur within about 500 feet to greatly reduce or eliminate the possibility of misidentifying conventional aircraft or other known phenomena.
Hynek’s scale achieved contact with the general public when it informed elements of the 1977 film Close Encounters of the Third Kind, which is named after the third level of the scale. The Hynek Scale is close encounters of the:
First Kind – these are close (less than 500 feet) human encounters with aerial objects displaying attributes not thought possible by human technology.
Second Kind – Include those encounters where some physical evidence is left behind such as burned ground, heat or radiation, disturbance of animals, interruption of radio or mechanical equipment, etc.
Third Kind – An observation of what Hynek termed “animate beings” observed in association with a UFO sighting. Hynek deliberately chose the somewhat vague term “animate beings” to describe beings associated with UFOs without making any unfounded assumptions regarding the beings’ origins or nature. Hynek did not necessarily regard these beings as “extraterrestrials” or “aliens.” Additionally, Hynek further expressed discomfort with such reports, but felt a scientific obligation to include them, at the very least because they represented a sizable minority of claimed UFO encounters. Since Hynek’s original scale of three types of close encounters, four more levels of the scale have been added by others. Hynek would probably not have supported any of these as additions to his original scale, as they cannot be examined using the scientific method (Hynek was the first to use, and was a strong advocate for, the application of the scientific method to UFO study).
Fourth Kind – Human abduction
Fifth Kind – Human-initiated contact with aliens.
Sixth Kind – Death or injury caused by contact with aliens.
Seventh Kind – Mating between humans and aliens that creates a human/alien hybrid.

The Bristol Stool Scale, or Bristol Stool Chart, is a medical aid designed to classify the form of human feces into seven categories. Sometimes referred to in the UK as the “Meyers Scale”, it was developed by Heaton at the University of Bristol, and was first published in the Scandinavian Journal of Gastroenterology in 1997. The form of the stool depends on the time it spends in the colon.
The seven types of stool are:
Type 1: Separate hard lumps, like nuts (hard to pass)
Type 2: Sausage-shaped, but lumpy
Type 3: Like a sausage but with cracks on its surface
Type 4: Like a sausage or snake, smooth and soft
Type 5: Soft blobs with clear cut edges (passed easily)
Type 6: Fluffy pieces with ragged edges, a mushy stool
Type 7: Watery, no solid pieces. Entirely liquid
Types 1 and 2 indicate constipation, with 3 and 4 being the “ideal stools” especially the latter, as they are the easiest to defecate, and 5–7 tending towards diarrhea.

